
I’m back on track. This time I would like to talk with you about maps. How easy we can work with maps nowadays. To be able to use maps on my website I will be using:
- Leaflet - JavaScript library for interactive maps
- Maps tiles
- Ruby on Rails (not required but you need to have at least some html file)
So first things first. What are they maps tiles? In simple words they are small square images, which show a map. They are served in packages. So on our website we see many of them.
How we can get tiles?
For beginning we can sign in into Mapbox which generates this kind of images or we can use OpenStreetMap. There are lot of services which also generate tiles. I will try to include some of them on the end.
Preparation
When we have in our application Leaflet library and we decided which tiles set we will be using, we can start.
On our index.html file we need to add:
<div id='map'></div>
And on our JavaScript file we need to set selected maps tiles. In this examples I will be using CoffeeScript but the same behaviour you can get in JavaScript.
jQuery ->
  map = L.map('map').setView([50.301, 18.654], 13)
Mapbox tiles
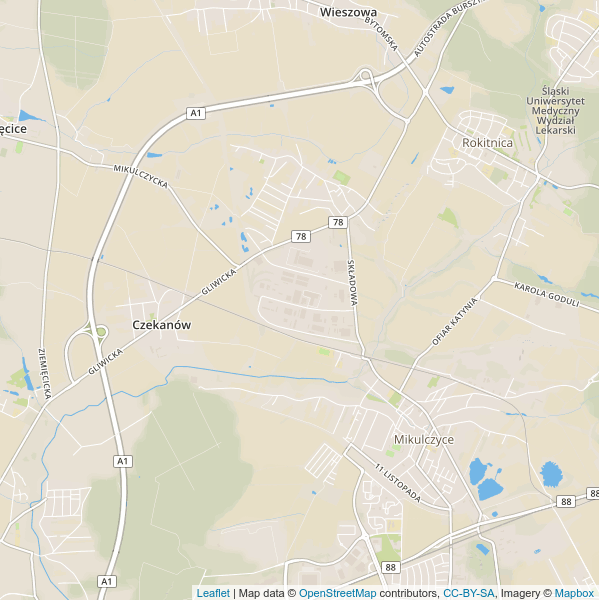
L.tileLayer('https://api.tiles.mapbox.com/v4/{id}/{z}/{x}/{y}.png?access_token={accessToken}', {
attribution: 'Map data © <a href="http://openstreetmap.org">OpenStreetMap</a> contributors, <a href="http://creativecommons.org/licenses/by-sa/2.0/">CC-BY-SA</a>, Imagery © <a href="http://mapbox.com">Mapbox</a>',
maxZoom: 18,
id: 'your id',
accessToken: 'your token'
}).addTo(map)
OpenStreetMap tiles
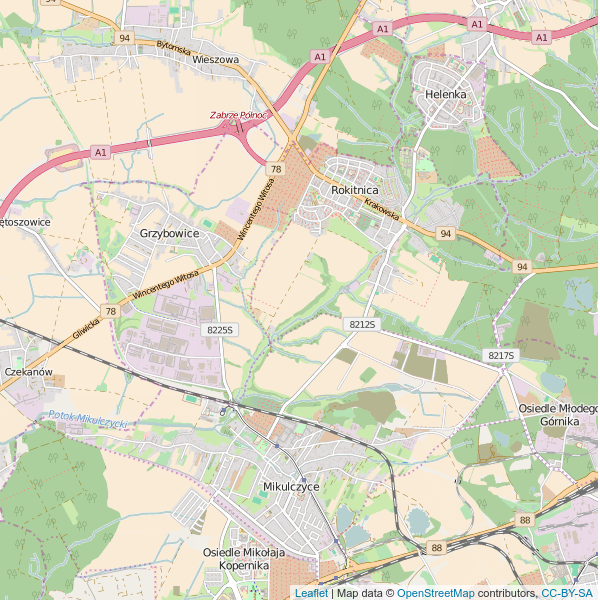
L.tileLayer('http://{s}.tile.osm.org/{z}/{x}/{y}.png', {
attribution: 'Map data © <a href="http://openstreetmap.org">OpenStreetMap</a> contributors, <a href="http://creativecommons.org/licenses/by-sa/2.0/">CC-BY-SA</a>',
maxZoom: 18
}).addTo(map)
Toner tiles
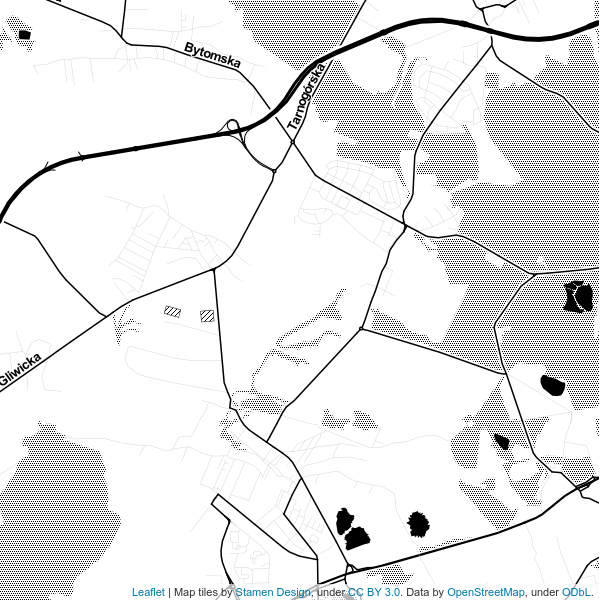
  L.tileLayer('http://tile.stamen.com/toner/{z}/{x}/{y}.png', {
      attribution: 'Map tiles by <a href="http://stamen.com">Stamen Design</a>, under <a href="http://creativecommons.org/licenses/by/3.0">CC BY 3.0</a>. Data by <a href="http://openstreetmap.org">OpenStreetMap</a>, under <a href="http://www.openstreetmap.org/copyright">ODbL</a>.',
      maxZoom: 18
  }).addTo(map)
WaterColor tiles
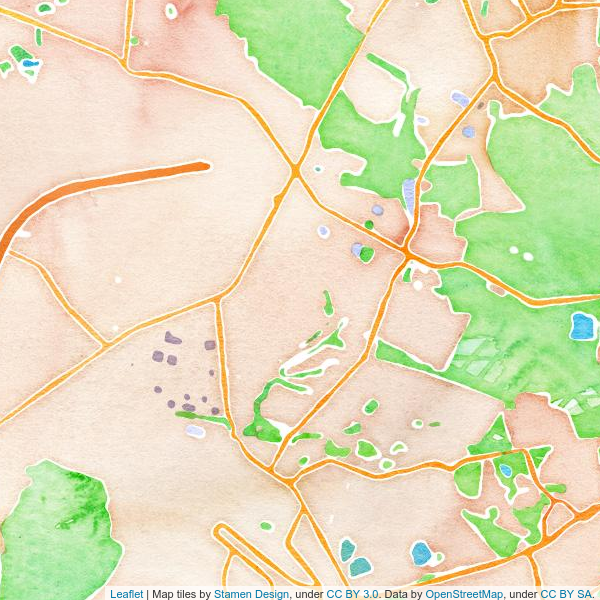
  L.tileLayer('http://tile.stamen.com/watercolor/{z}/{x}/{y}.png', {
      attribution: 'Map tiles by <a href="http://stamen.com">Stamen Design</a>, under <a href="http://creativecommons.org/licenses/by/3.0">CC BY 3.0</a>. Data by <a href="http://openstreetmap.org">OpenStreetMap</a>, under <a href="http://creativecommons.org/licenses/by-sa/3.0">CC BY SA</a>.',
      maxZoom: 18
  }).addTo(map)
And that’s it! When you refresh your website you should see map.
Putting objects on map
Now is time for fun! We can put on map different objects. One very important thing - each object on map has it own coordinates (like in Maths). In Leaflet are used two coordinate system. Cartesian coordinate geometry and Lat-long system. In first one point is [longitude, latitude] in second [latitude, longitude]. It is very easy to remember where is used which coordination system. For GeoJSON object we use Cartesian notation and for the rest Lat-long notation.
Marker
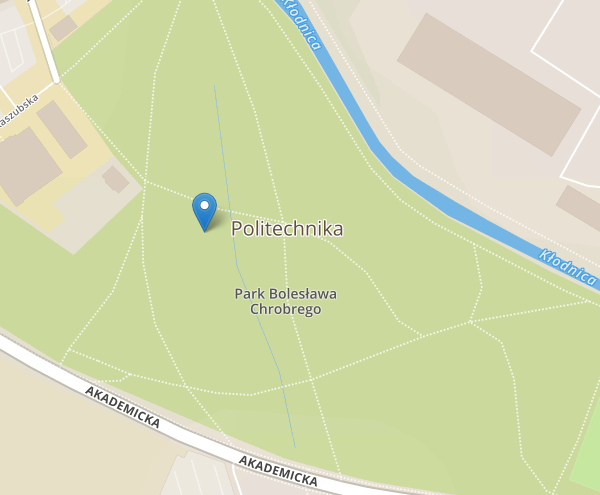
marker = L.marker([50.28895538456755, 18.681907653808594]).addTo(map)
Custom marker
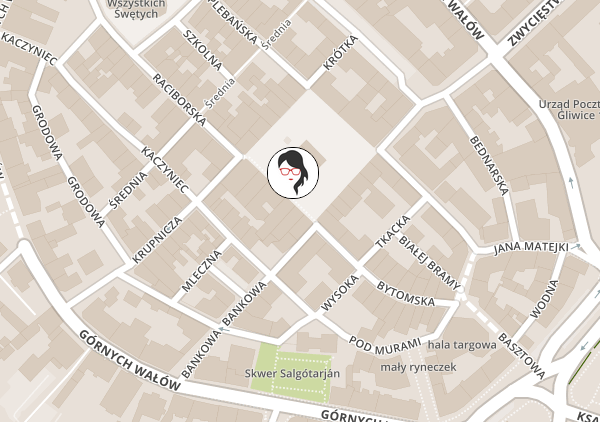
customIcon = L.icon(
  iconUrl: 'assets/womanonrails.jpg'
  iconSize:     [50, 50]
  iconAnchor:   [25, 25]
  className: 'round'
)

customMarker = L.marker(
  [50.29391802001304, 18.665471076965332],
  icon: customIcon
).addTo(map)
HTML marker
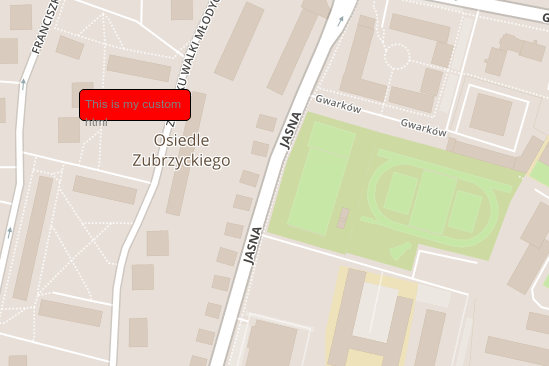
divIcon = L.divIcon(
  className: 'div-icon'
  html: '<div>This is my custom html</div>'
  iconSize: [100, 20]
)

L.marker([50.2845132498121, 18.668603897094727], icon: divIcon).addTo(map)
Circle
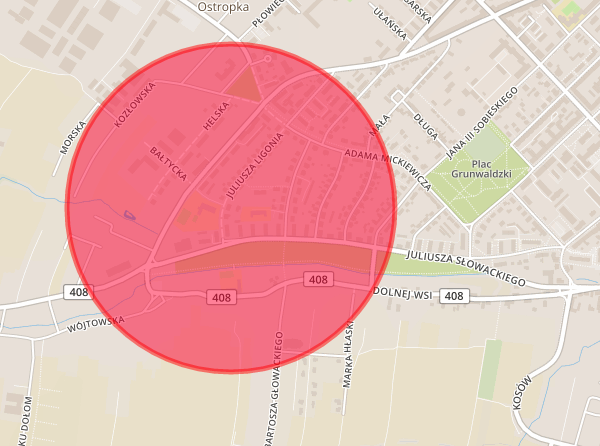
circle = L.circle(
  [50.290024725454515, 18.640880584716797], 500,
  color: 'red',
  fillColor: '#f03',
  fillOpacity: 0.5
).addTo(map)
Polygon
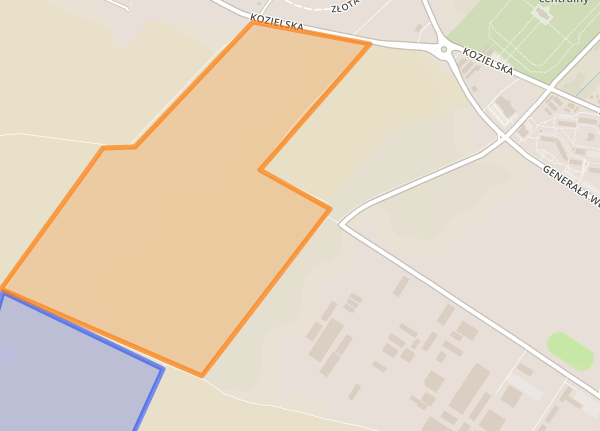
polygon = L.polygon([
  [50.29830444909283, 18.61384391784668],
  [50.29619353058144, 18.620710372924805],
  [50.29084727901576, 18.616890907287598],
  [50.29125855046426, 18.61354351043701],
  [50.2941373510724,  18.611998558044434],
  [50.29830444909283, 18.61384391784668]
]).addTo(map)
Popups
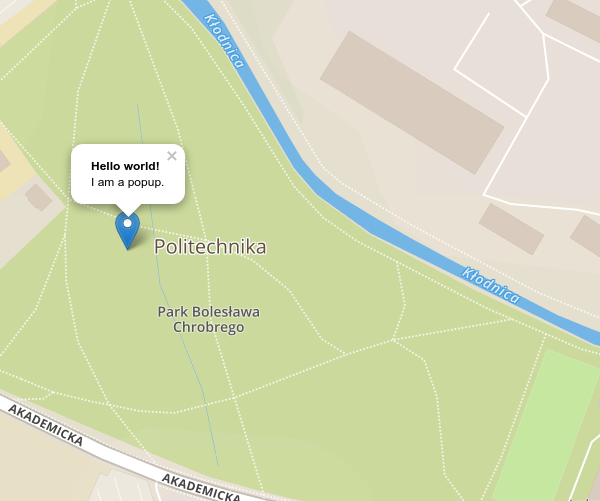
marker.bindPopup("<b>Hello world!</b><br>I am a popup.").openPopup()
circle.bindPopup("I am a circle.")
polygon.bindPopup("I am a polygon.")
popup = L.popup()
  .setLatLng([51.5, -0.09])
  .setContent("I am a standalone popup.")
  .openOn(map)
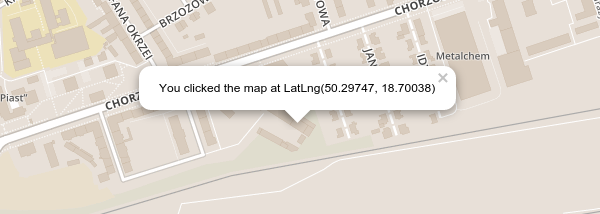
Events
onMapClick = (e) -> console.log "Coordinate: #{e.latlng}"
map.on('click', onMapClick)
onMapClick = (e) ->
  popup = L.popup()
  popup.setLatLng(e.latlng)
  popup.setContent("You clicked the map at #{e.latlng}")
  popup.openOn(map);
  console.log "Coordinate: #{e.latlng}"

map.on('click', onMapClick)
GeoJSON
I think the most powerful element of Leaflet is geoJson. You can display every of further objects using geoJson. Also you can use GIS data from data base like PostgreSQL and directly use in geoJson object. For this element you can also use some styling or binding events.
geoData = {
  "type": "Feature",
  "properties": {},
  "geometry": {
    "type": "Polygon",
    "coordinates": [[
      [18.613758087158203, 50.298386690775416],
      [18.618135452270508, 50.3022518894775],
      [18.619508743286133, 50.302279301112605],
      [18.62457275390625, 50.30570563109659],
      [18.62959384918213, 50.30510261491786],
      [18.624873161315918, 50.3016488295082],
      [18.627877235412598, 50.3005797498622],
      [18.622384071350098, 50.29600162425392],
      [18.613758087158203, 50.298386690775416]
    ]]
  }
}

style = {
  "color": "#ff7800",
  "weight": 5,
  "opacity": 0.65
}

L.geoJson(geoData, style: style).addTo(map)
On the end
This is only a small pieces of Leaflet possibilities. If you looking for more (for example drawing on map) checkout links below:
- Leaflet
- Leaflet Draw
- GeoJSON
- Leaflet Routing Machine
- OpenLayers
- Google Maps JavaScript API
- Modest Maps
- OpenStreetMap
- Microsoft Bing Maps
- Google Maps
- Mapbox
- MapTiler
- Maps Stamen
- Map Quest
- Tiles
Need help?
If you're looking for a Ruby developer with over a decade of experience, don't hesitate to contact me.
I have experience in a variety of domains, with a focus on short user feedback loops and teamwork. I can help you build a great product.
Woman on Rails Newsletter
Join a community of like-minded readers and receive my short, insightful emails on self-development, software development, productivity, and team management. Plus, from time to time, I'll share personal insights and stories from the IT world.